In this ecommerce statistics overview, you’ll find all the key facts from the world of online selling: data on global ecommerce, the average spend of ecommerce shoppers, leading ecommerce platforms, social ecommerce and much more…
Please note: you are free to use any of the ecommerce statistics featured in this post in your own articles. However, we’d politely request that you credit Style Factory as a source and provide a link to this post when doing so. Thank you!
Article highlights
- What is ecommerce?
- What types of ecommerce business models are there?
- What is the compound annual growth rate of ecommerce businesses?
- What are the fastest-growing ecommerce countries?
- What is the average spend of ecommerce shoppers?
- Global ecommerce statistics
- US ecommerce statistics
- Ecommerce platform statistics
- Ecommerce marketplace statistics
- Social ecommerce statistics
- Mobile ecommerce statistics
- Ecommerce marketing statistics
- Ecommerce shipping statistics
- Ecommerce abandoned cart statistics
- Ecommerce dropshipping statistics
What is ecommerce?
- Ecommerce — short for ‘electronic commerce’ — is generally defined as the buying and selling of goods and services using the Internet. There is very little you cannot get your hands on via ecommerce: houses, horses, hair extensions and hat pins are all available for purchase online from tens of millions of stores and marketplaces. (Source: Investopedia.)
- The term ‘ecommerce’ was first used in 1984 by Dr Robert Jacobson, Principal Consultant to the California State Assembly’s Utilities & Commerce Committee. (Source: Wikipedia.)
What types of ecommerce business models are there?
- Some commentators claim that there are 6 types of online business models:
- B2C: Business-to-Consumer
- C2B: Consumer-to-Business
- B2B: Business-to-Business
- C2C: Consumer-to-Consumer
- B2A: Business-to-Administration
- C2A: Consumer-to-Administration.
- However, within any one ecommerce model, there are arguably tens and tens of ‘sub-models’ of ecommerce business, including dropshipping businesses, subscription services and white-labelling.
- The vast majority of ecommerce businesses employ a business-to-consumer (B2C) or business-to-business (B2B) ecommerce model. (Source: Research and Markets.)
- By 2030, the global B2B ecommerce market is forecast to exceed $57 trillion — and could reach as much as $60 trillion — underscoring its position as by far the largest segment of online commerce. (Sources: Grand View Research; Research and Markets.)
What is the compound annual growth rate of ecommerce businesses?
- From 2026 onward, the global B2C ecommerce market is expected to grow rapidly, with forecasts suggesting a compound annual growth rate (CAGR) of around 19% through 2030. (Source: Grand View Research.)
- From 2026 onward, China’s ecommerce market is expected to continue expanding rapidly, with forecasts suggesting compound annual growth of approximately 11–12% through 2030. (Source: Grand View Research.)
What are the fastest-growing ecommerce countries?
- From 2026 onward, many of the world’s fastest-growing ecommerce markets are expected to be in Asia, led by the Philippines and India, with annual growth rates projected to remain above 15% in several major Southeast Asian economies. Other high-growth markets in the region include Indonesia, Vietnam, Thailand, and Malaysia — highlighting Asia’s continued dominance in ecommerce expansion. (Source: Statista.)
What is the average spend of ecommerce shoppers?
- The average ecommerce website generated approximately $3.05 in revenue per visit globally in 2025, reflecting the fact that most visitors do not make a purchase and highlighting the importance of conversion rate optimization. (Source: Statista.)
- The health and beauty category generates the highest revenue per visit, at around $3.10 per visitor, followed by consumer electronics and home appliances at approximately $2.70 per visit, demonstrating strong monetization performance in these sectors. (Source: Statista.)
- Don’t let these numbers put you off starting your own ecommerce store — the ‘average order value’ (AOV) for a Shopify store is reportedly $85 per order, with the top-performing 20% and 10% of Shopify ecommerce stores having an AOV of $192 and $311 respectively. (Source: Little Data.io.)
Global ecommerce statistics
- Global retail ecommerce sales totaled approximately $6.42 trillion in 2025, with online purchases accounting for around 20.5% of total global retail sales, confirming ecommerce’s continued expansion as a core retail channel worldwide. (Sources: Capital One Shopping; Couponsly.)
- Global retail ecommerce sales are forecast to reach approximately $7.38 trillion in 2026, reflecting continued steady growth in online retail worldwide. (Source: Statista.)
- In 2024, Asia dominated as the largest e-commerce market globally, with its total online retail revenue nearing 2 trillion U.S. dollars. This figure surpassed the Americas’ e-commerce revenue by about 500 million U.S. dollars. In contrast, regions such as Australia, Oceania, and Africa reported significantly smaller e-commerce revenues, each below 50 billion U.S. dollars. (Source: Statista.)
- There are estimated to be approximately 30.7 million ecommerce websites worldwide as of 2025–2026, reflecting the continued rapid expansion of online retail globally. (Source: BuiltWith.)
- China, the United States, and Japan remain the world’s three largest ecommerce markets. China generated approximately $1.65 trillion in ecommerce revenue in 2025, followed by the United States at around $1.34 trillion, and Japan at approximately $190 billion, highlighting the continued dominance of these three economies in global online retail. (Source: Statista.)
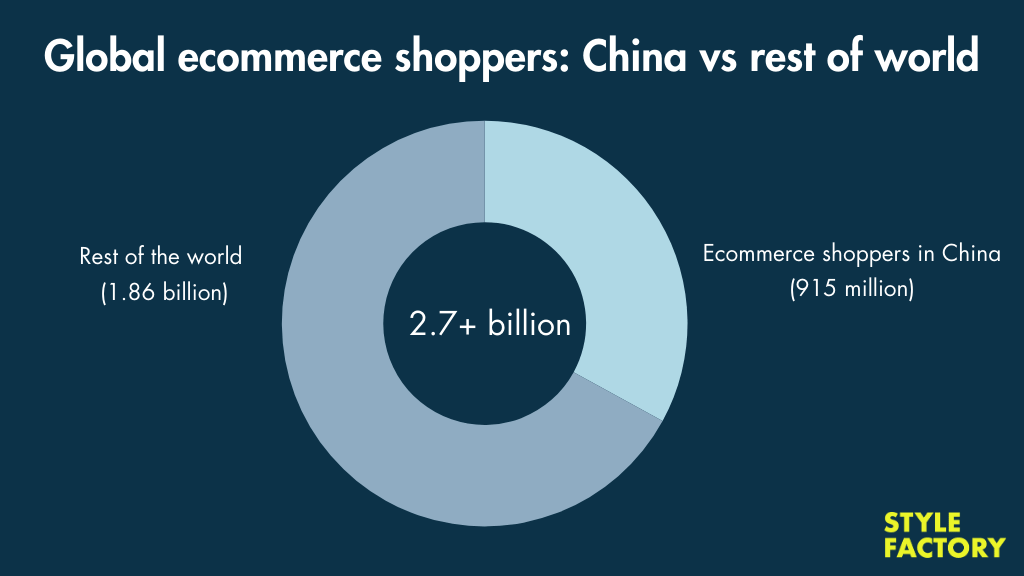
- China had approximately 915 million digital buyers in 2025, representing by far the largest ecommerce user base in the world and accounting for well over 40% of global ecommerce shoppers. (Source: Statista.)
- China is expected to have approximately 941 million ecommerce shoppers by 2027, meaning roughly two-thirds of its entire population will be buying goods online. (Source: Statista.)
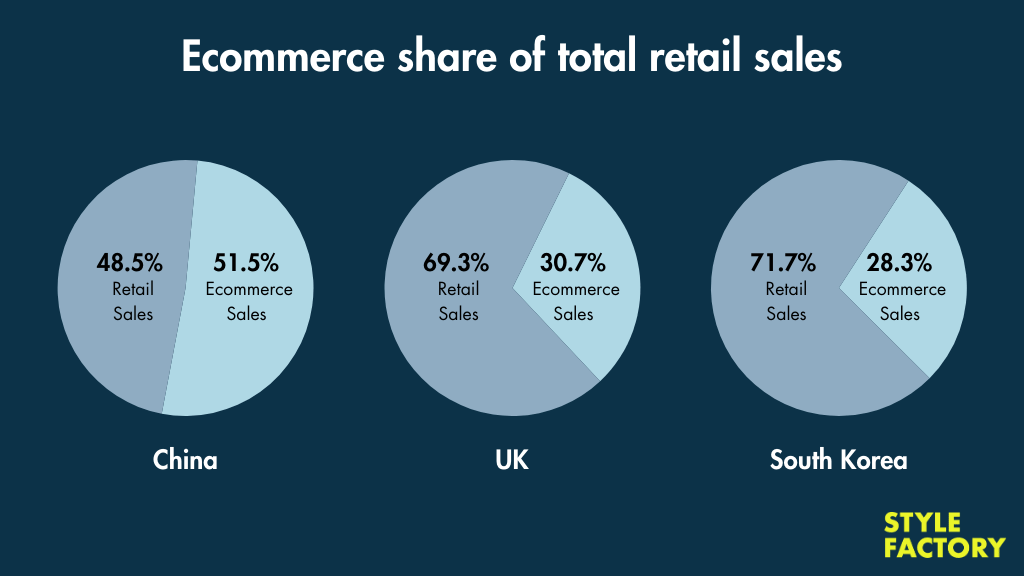
- China has the highest ecommerce penetration of any major economy, with online sales accounting for approximately 51.5% of total retail sales in 2025, and forecast to rise further to approximately 53.7% in 2026, reinforcing its position as the world’s most digitally advanced retail market. (Source: Insider Intelligence.)
- China’s total online retail sales reached approximately 15.97 trillion yuan in 2025, representing year-on-year growth of 8.6%. Of this, online retail sales of physical goods accounted for 13.09 trillion yuan, making up 26.1% of China’s total retail sales of consumer goods, highlighting the central role ecommerce now plays in China’s retail economy. (Source: National Bureau of Statistics of China.)
- Ecommerce user penetration in China reached approximately 43.1% in 2025, and is forecast to rise further to approximately 49.6% by 2029, reflecting continued growth in online shopping adoption across the world’s largest ecommerce market. (Source: Statista.)
- The average revenue per user (ARPU) in China’s ecommerce market reached approximately $1,746 per user in 2025, highlighting the strong spending power of Chinese online shoppers and the maturity of China’s digital retail ecosystem. (Source: Statista.)
- Ecommerce accounted for approximately 30.7% of total retail sales in the United Kingdom in 2025, making the UK one of the most ecommerce-focused major retail markets in the world. (Source: Insider Intelligence.)
- South Korea, Indonesia, and Norway are among the countries with the highest ecommerce retail penetration after China and the UK, with online sales accounting for approximately 28.3% of total retail sales in South Korea, 28.9% in Indonesia, and 21.4% in Norway in 2025, highlighting the continued global expansion of ecommerce across diverse markets. (Source: Emarketer.)
- Despite having two of the world’s largest ecommerce markets by total revenue, ecommerce accounted for only approximately 16.9% of total retail sales in the United States and 14.5% in Canada in 2025, reflecting the continued importance of physical retail in North America compared to more digitally mature markets like China and the UK. (Source: Insider Intelligence.)
- China remains the dominant force in global ecommerce, accounting for approximately 50.4% of total worldwide ecommerce sales in 2025, compared to around 20.1% for the United States, meaning China’s ecommerce market is still more than twice the size of the US market. (Source: Emarketer.)
- China, the United States, and the United Kingdom remain the world’s three largest ecommerce markets, accounting for approximately 74% of total global ecommerce sales combined in 2025, with China representing about 50.4%, the United States 20.1%, and the United Kingdom approximately 3.5% of the global market. (Source: Emarketer.)
- You can see the full top ten countries in terms of overall ecommerce market share in the infographic below:
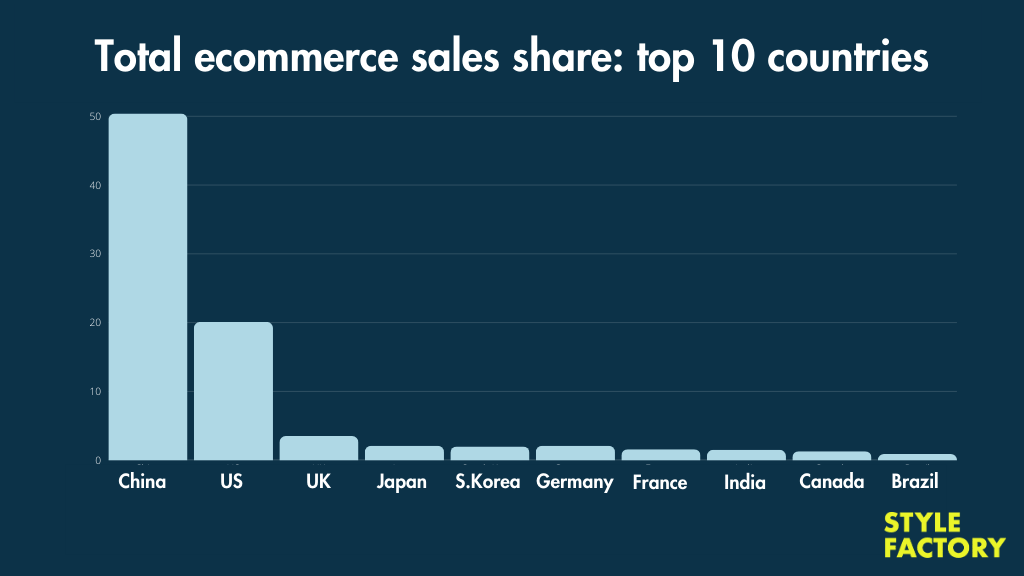
- Although tenth place Brazil accounted for only approximately 0.9% of global ecommerce sales in 2025, it remains the dominant ecommerce market in Latin America, where it represents roughly 29% of the region’s total online retail revenue, highlighting its continued importance as a fast-growing digital commerce market. (Source: Emarketer.)
Speaking of ecommerce countries that are making big moves…
US ecommerce statistics
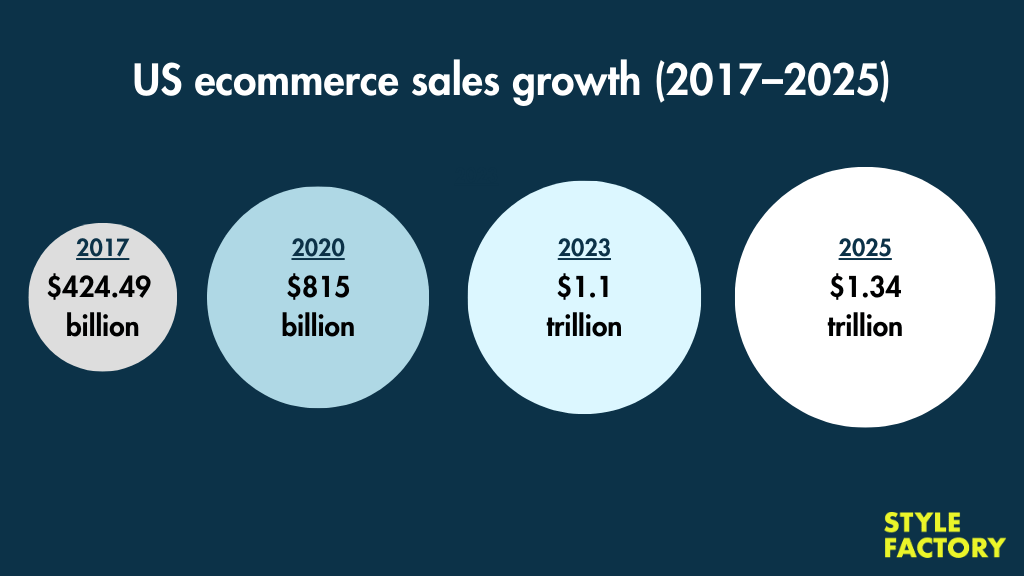
- U.S. ecommerce sales reached approximately $1.34 trillion in 2025, reflecting continued strong growth and reinforcing the United States’ position as the world’s second-largest ecommerce market. (Source: Statista.)
- U.S. retail ecommerce sales totaled approximately $1.34 trillion in 2025, accounting for around 16.9% of total retail sales, highlighting the continued steady growth of online retail in the world’s second-largest ecommerce market. (Source: U.S. Census Bureau.)
- U.S. ecommerce sales totaled approximately $1.19 trillion in 2024, representing an increase of 8.1% over 2023, according to official figures from the U.S. Census Bureau. (Source: U.S. Census Bureau.)
- Clothing and apparel remains the most popular ecommerce product category in the United States, with approximately 46% of online shoppers purchasing fashion items online in 2025, followed by consumer electronics (33%), shoes (31%), beauty and personal care products (29%), and books, movies, music, and games (27%). (Source: Statista.)
- Apparel and consumer electronics remain the two largest ecommerce product categories in the United States, generating approximately $206 billion and $174 billion in online sales respectively in 2025, highlighting their continued dominance in the world’s second-largest ecommerce market. (Source: Statista.)
| Consumer Electronics | $206.42 billion |
| Apparel and Accessories | $174.56 billion |
| Furniture and Decor | $141.79 billion |
| Health, Personal Care, and Beauty | $119.34 billion |
| Auto and Parts | $98.72 billion |
- Amazon remains the dominant starting point for online shopping in the United States, with approximately 56% of U.S. consumers beginning their product searches on Amazon in 2025, compared to around 46% who start on search engines like Google, while Walmart accounts for roughly 30% of initial product searches, reflecting its continued ecommerce growth. (Source: Jungle Scout.)
- Ecommerce accounted for approximately 16.9% of total retail sales in the United States in 2025, reflecting continued steady growth in online shopping across the country. (Source: Emarketer.)
- U.S. ecommerce sales are forecast to grow at an average annual rate of approximately 7.2% between 2025 and 2029, reflecting steady but moderating expansion in an increasingly mature ecommerce market. (Source: Statista.)
- Amazon remained by far the largest ecommerce retailer in the United States in 2025, generating approximately $540 billion in online sales, compared to around $108 billion for Walmart and approximately $46 billion for Apple, highlighting Amazon’s continued dominance of the U.S. ecommerce market. (Sources: Emarketer; Statista.)
- U.S. ecommerce sales totaled approximately $1.34 trillion in 2025, reflecting continued steady growth and reinforcing the country’s position as the world’s second-largest ecommerce market. (Source: Statista.)
- December remained the single biggest month for U.S. ecommerce in 2025, accounting for approximately 9%–10% of total annual online retail sales, reflecting the enormous impact of holiday shopping on ecommerce revenue. (Sources: U.S. Census Bureau; Statista.)
- February remains one of the slowest months for U.S. ecommerce, typically accounting for approximately 6%–7% of total annual online retail sales, reflecting the post-holiday slowdown in consumer spending. (Sources: Statista.)
Ecommerce platform statistics
An ecommerce platform is software that allows individuals and brands to create their own ecommerce website. These platforms — such as Shopify, BigCommerce and Wix — provide ecommerce merchants with customizable templates for designing their store, integrated payment systems, and the option to integrate a range of apps that provide additional selling features to their stores. They usually facilitate point of sale selling too.
By contrast, ecommerce ‘marketplaces’, which we discuss in the next section, are more like a huge online supermarket where you sell goods alongside those of your competitors. Online marketplaces like Amazon and eBay are generally quite restrictive in terms of how you sell your products; but the upside of marketplaces is that they provide merchants with a large, ready-made audience of high-intent buyers.
Here are some ecommerce platform statistics you need to know:
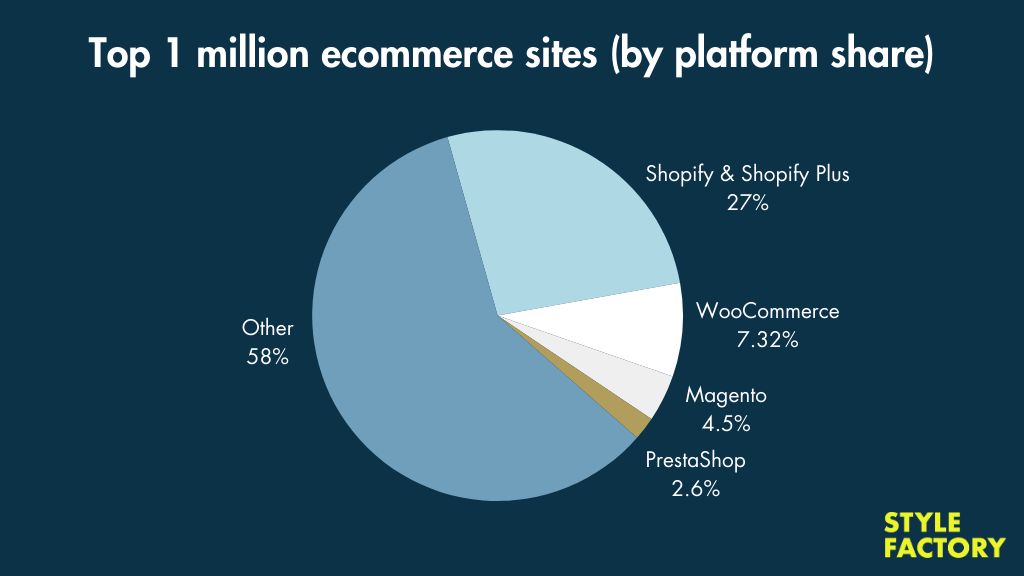
- Among the web’s top 1 million sites, Shopify is currently the most popular ecommerce platform — it’s used by 27% of them to sell goods. (Source: Builtwith.)
- WooCommerce is in second place, with a 7% share of the world’s top one million ecommerce sites. (Source: Builtwith.)
- As for overall ecommerce platform market share, WooCommerce powers nearly four out of every ten ecommerce websites globally, making it by far the most widely used ecommerce platform, ahead of Shopify, Wix, and Squarespace. (Source: BuiltWith.)
- In the US, Shopify is used by 27.79% of ecommerce merchants, 6 percentage points ahead of Wix in second place with 21% and Squarespace in third with 15% of the market. (Source: Builtwith.)
- WordPress is the most popular website building software in the world, with around 36.8+ million sites built on the platform. However, it does not feature any built-in ecommerce functionality. Instead, WordPress users need to install third-party ecommerce plug-ins to facilitate ecommerce selling. WooCommerce absolutely dominates this plug-in market, possessing an 84% share among the top million sites. Ecwid’s plug-in option comes a distant second with a 5% market share. (Source: Builtwith.)
Ecommerce marketplace statistics
An ecommerce marketplace (also known as an ‘online marketplace’) is a website that offers lots of different products from a large variety of brands and sellers. Amazon, eBay and Etsy are some of the best-known ecommerce marketplaces — each with millions of customers and hundreds of millions of products in their inventories.
Let’s take a look at some of the top statistics in the booming world of ecommerce marketplaces.
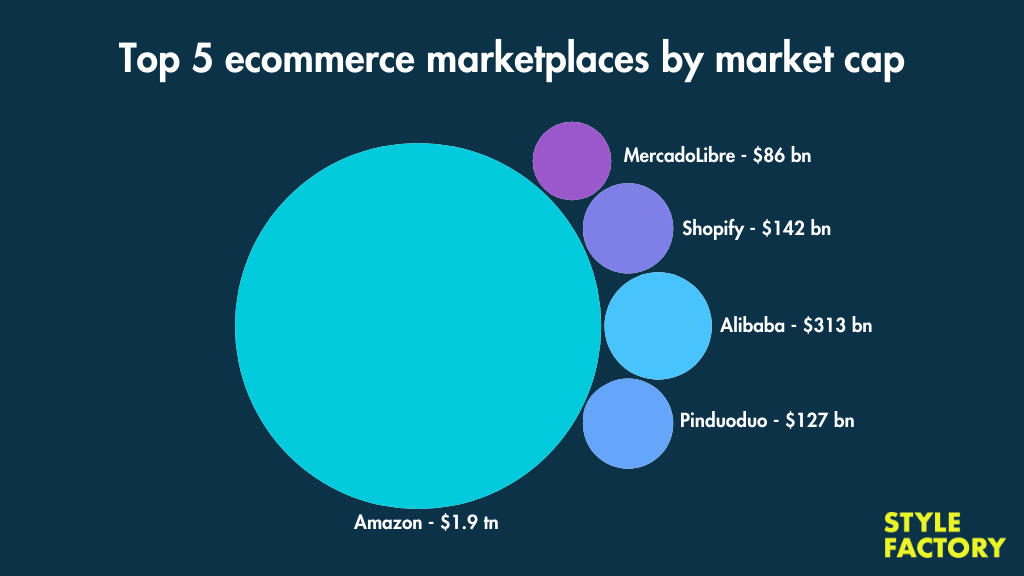
- Amazon is the largest ecommerce marketplace in the world with a market capitalization of 1.9 trillion US dollars. China’s Alibaba is ranked second with a market cap of $313 billion, followed by Canada’s Shopify with a $142 billion valuation. Chinese marketplace Pinduoduo is in fourth place: ($127 billion); and MercadoLibre is in 5th place with a valuation of $86 billion.
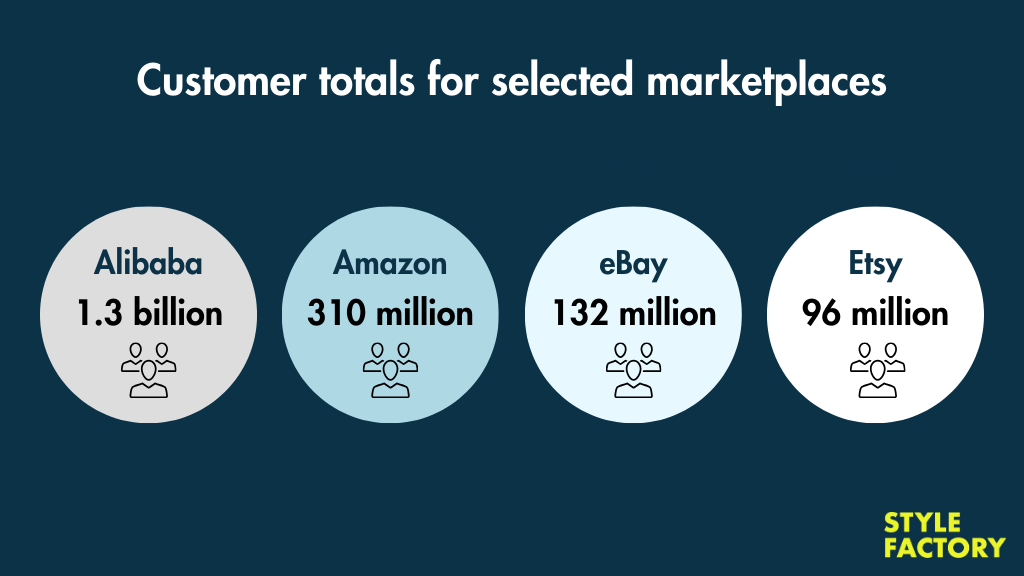
- Alibaba remains one of the world’s largest ecommerce platforms by active users, with approximately 1.3 billion annual active consumers in China as of 2025, compared to an estimated 310 million active Amazon customers in the United States, while eBay reported approximately 132 million active buyers globally, and Etsy reported around 96 million active buyers. (Sources: Statista, Jungle Scout, eBay and Etsy.)
- Amazon generated nearly $684 billion in total revenue in 2025, maintaining its position as the world’s largest ecommerce and online retail company by a wide margin. (Source: Amazon.)
- A reported 55% of businesses selling through online marketplaces have a profit margin of more than 20%. (Source: BigCommerce.)
- Amazon has 2.47 billion unique monthly visitors, which is more than 5 times that of eBay’s total of 532 million visitors each month. (Source: Semrush.)
- When it comes to the total numbers of customers for some of the top online marketplaces, Alibaba has a commanding lead with 1.3 billion customers compared to Amazon’s 310 million strong customer base. Other notable performers include eBay with 134 million customers, and Etsy, which has 87 million shoppers. (Sources: Alibaba, Statista and eBay.)
- In the US, Amazon is the top marketplace performer when it comes to ‘average visit duration’, with Amazon customers spending an average of 6:19 minutes on the site per visit. (Source: Similarweb.)
- eBay and Etsy customers also spend significant amounts of time on these marketplaces: eBay visitors spend 6:13 minutes per visit and Etsy visitors spend 4:56 minutes. (Source: Similarweb.)
- The average number of page views per visit on Amazon is 9.64, compared to 6.83 pages per visit on eBay and 6.18 pages per visit on Etsy. (Source: Similarweb.)
- eBay has over 2.4 billion live listings. (Source: eBay.)
- The top seller on Etsy is PlannerKate1 with over 2.1 million sales of stationery and stickers. (Source: Startupbonsai.)
What are the biggest ecommerce sectors?
- Fashion remains the largest global ecommerce sector, generating approximately $1.03 trillion in revenue worldwide in 2025, making it the dominant category in online retail. (Source: Statista.)
- Consumer electronics is the second-largest ecommerce sector globally, with approximately $922 billion in online sales in 2025, reflecting strong demand for smartphones, computers, and related technology products. (Source: Statista.)
- Toys, hobby, and DIY products rank third, generating approximately $741 billion in ecommerce revenue worldwide in 2025, driven by continued growth in home improvement and recreational product sales. (Source: Statista.)
Social media ecommerce statistics
Social ecommerce refers to the selling and promotion of ecommerce products through social media apps such as Instagram, Facebook, TikTok, Pinterest and many more.
Global social commerce sales reached approximately $945 billion in 2025, and are projected to grow to around $2.9 trillion by 2029, highlighting the rapidly expanding role of platforms like TikTok, Instagram, and Facebook in driving online retail. (Source: Statista.)
Social ecommerce is getting BIGGER!
Let’s find out why.
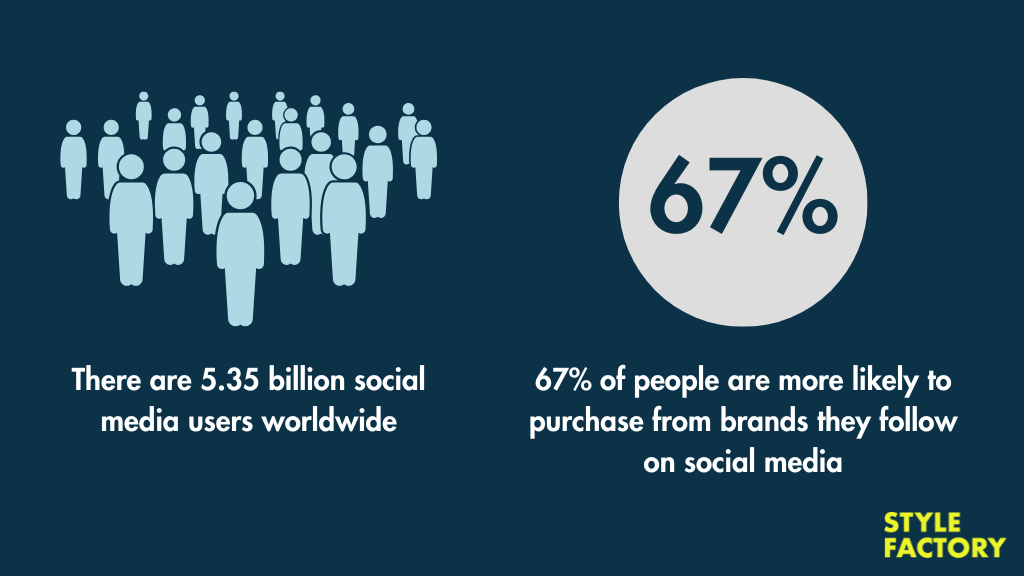
- There were approximately 5.35 billion social media users worldwide in early 2026, representing around 65% of the global population, with this number forecast to exceed 5.85 billion by 2027, reflecting continued global growth in social platform adoption. (Source: Datareportal.)
- Around 67% of consumers say they are more likely to purchase from brands they follow on social media, demonstrating the strong influence of social platforms on purchasing decisions. (Source: Sprout Social.)
- Social commerce adoption is significantly higher in China than in the United States, with approximately 52% of Chinese social media users making purchases through social platforms in 2025, compared to around 39% of U.S. social media users, highlighting China’s leadership in social-driven ecommerce. (Source: Statista.)
- Between 2020 and 2022, social commerce sales in the United States are estimated to have doubled from $26.9 billion to around $56 billion. (Source: Insider Intelligence.)
- TikTok remains the leading social commerce platform globally, with approximately 22% of its users reporting that they regularly make purchases directly through the app, highlighting its growing influence on online shopping behavior. (Source: Insider Intelligence.)
- Instagram, Facebook, and YouTube remain highly influential ecommerce platforms, with approximately 70% of Instagram users, 65% of Facebook users, and 63% of YouTube users reporting that social media influences their purchasing decisions, highlighting the critical role these platforms play in product discovery and online shopping. (Sources: Statista; DataReportal; Emarketer.)
- More than six in ten TikTok users discover new products on the platform, and over half have made purchases influenced by TikTok, underscoring its powerful role in driving ecommerce sales. (Sources: Statista and TikTok.)
- The viral #TikTokMadeMeBuyIt hashtag has accumulated more than 75 billion views, demonstrating TikTok’s extraordinary power to drive ecommerce product discovery and sales. (Source: TikTok.)
- China’s live-stream shopping market generated nearly 5.7 trillion yuan ($790 billion) in sales in 2024, making it one of the fastest-growing segments of the global ecommerce industry. (Source: Statista.) (Source: Statista.)
- Douyin, TikTok’s Chinese counterpart, has become one of the world’s largest live commerce platforms, generating approximately 2.7 trillion yuan ($375 billion) in ecommerce transaction value in 2024, up dramatically from just 120 billion yuan in 2019, while TikTok has rapidly expanded its ecommerce capabilities globally through TikTok Shop. (Source: Statista.)
How much ecommerce fraud is there?
- According to a 2025 summary of global e-commerce fraud data, total losses due to e-commerce fraud in 2024 were estimated at ≈ US$ 44.3 billion. (Source: Cropink.)
- One recent report from a global survey of over 1,000 merchants shows that many use modern fraud-prevention methods: around 60% use payment tokenization. (Source: Merchant Risk Council.)
- It is reported that “for every US$100 in fraudulent orders, merchants lose US$207” (because of chargebacks, shipping, overhead, etc.). (Source: Exploding Topics.)
- 29.8% of ecommerce fraud attacks are due to ‘account takeovers’, and 24.1% of fraud attacks are as a result of people posing as bots. (Source: Finances Online.)
Ecommerce search behavior statistics
- Around 59% of shoppers say they always research products online before buying, reflecting the importance of digital research in helping consumers make informed purchasing decisions. (Source: Google.)
- Mobile devices now play a central role in in-store shopping, with approximately 58% of consumers using their smartphones to research products while inside a physical store, highlighting the importance of mobile-optimized ecommerce websites and product information. (Source: Google.)
- Google reports that searches for ‘cheap electric cars’ and ‘cheap holidays’ have grown by 50% and 400% respectively over the last year. (Source: Google.)
- People looking to buy high-end fashion online are also looking for good value — the search term ‘designer outlet’ has seen a 90% rise in the last 12 months. (Source: Google.)
Mobile ecommerce statistics
- Mobile devices accounted for approximately 46.7% of total global ecommerce sales in 2025, reflecting the continued shift toward smartphones as the primary channel for online shopping. (Source: Emarketer.)
- Global consumers spent approximately 42 billion hours using mobile shopping apps in 2025, highlighting the growing importance of smartphones as a primary channel for ecommerce. (Source: data.ai.)
- Mobile devices have become the dominant ecommerce channel, with approximately 76% of consumers using their smartphones to make online purchases in 2025, reflecting the continued shift toward mobile-first shopping. (Source: OuterBox.)
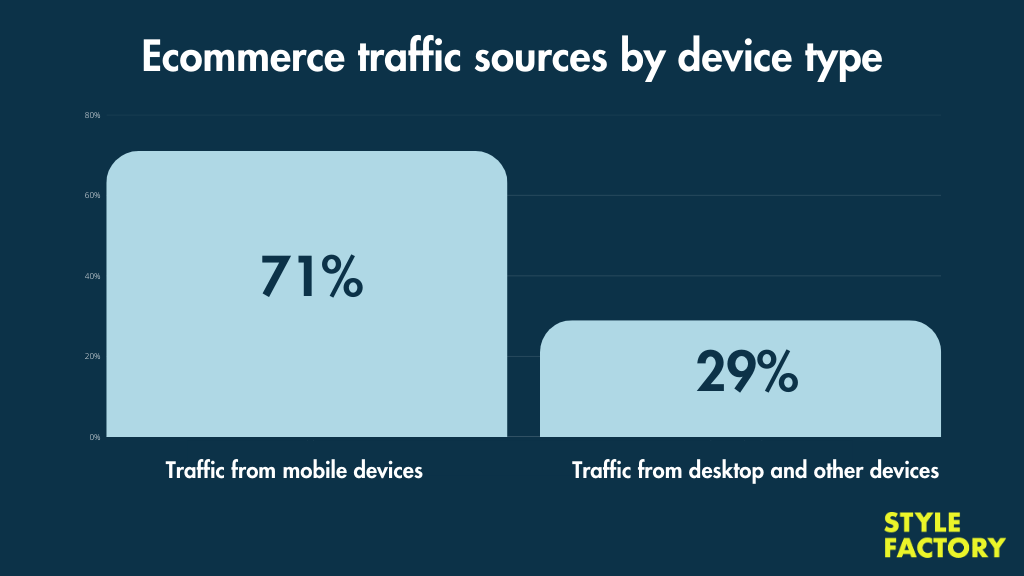
- 71% of traffic to ecommerce sites comes from mobile phones, compared to just 29% on desktop and other devices. (Source: SaleCycle.)
- However, ecommerce conversion rates on mobile devices are lower on mobile (2%) than on desktop (3%). (Source: Statista.)
- In the United States, 46.9% of ecommerce shoppers on mobile devices are aged between 18—24; 25—34 year olds also make up a large slice of this market, representing 31.8% of mobile shoppers. (Source: Statista.)
- Mobile commerce accounted for approximately 47.8% of total U.S. ecommerce sales in 2025, and is projected to exceed 51% by 2027, meaning the majority of online purchases in the United States will soon take place on smartphones. (Source: Emarketer.)
- Digital wallets have become the dominant ecommerce payment method globally, accounting for approximately 50% of all online transaction value in 2024, and projected to rise to around 54% by 2027, highlighting the growing importance of services like Apple Pay, Google Pay, PayPal, and Alipay. (Source: Worldpay Global Payments Report.)
- Internationally, the two leading digital wallet companies are both Chinese: AliPay and WeChat Pay. AliPay has approximately 650 million users and WeChat Pay has around 550 million users. (Source: Business of Apps.)
- In the US, Apple Pay is the digital wallet market leader with 43.9 million users (roughly 18 million users more than Google Pay). Perhaps surprisingly, Starbucks’ digital wallet is the second most popular among US users, with over 31.2 million Americans using the service. (Source: Business of Apps.)
- Apple Pay is used by more than 500 million consumers worldwide, while Google Pay has in excess of 400 million users. (Source: Business of Apps.)
Ecommerce advertising statistics
- The global digital advertising market is estimated to be worth around $715 billion, with search advertising remaining the largest segment and accounting for hundreds of billions of dollars in annual ad spend. (Source: Statista.)
- The United States is the world’s largest digital advertising market, with digital ad spend projected to reach around $310 billion in 2025 — accounting for roughly 40% of global digital advertising revenue. (Source: Statista.)
- Over 30% of products advertised in ‘pay per click’ campaigns are on sale. In the case of Fashion products and Health and Beauty products, up to 37% of products featured in ads feature discounted pricing. (Source: User Guiding.)
- Remarkably, 16% of ecommerce products advertised globally are actually out of stock. (Source: User Guiding.)
- 99.01% of all products advertised online are categorized as ‘new’. However, in the electronics sector — computers, phones, audio equipment, etc. — almost 18% of advertised products are listed as either used or refurbished. (Source: User Guiding.)
- 34.68% of ads for video game consoles are for previously used items. (Source: User Guiding.)
Ecommerce marketing statistics
- Blogging is one of the most popular forms of content marketing: more than 75% of Fortune 500 companies have a public-facing blog on their website. (Source: Statista.)
- Email is used by an estimated 4.6 billion people worldwide, with approximately 376 billion emails sent and received each day. (Source: Statista.)
- Email is the third most popular channel for distributing digital marketing content (behind company websites and blogs), with 69% of marketers and brands employing email newsletters in their marketing activities. (Source: Content Marketing Institute.)
- Of the many industries using email marketing, ecommerce ranks highest when it comes to return on investment (‘ROI’) — for every dollar invested in an email marketing campaign, ecommerce companies earn $45 on average. (Source: Statista.)
- Emails sent by companies with an ecommerce focus have an average open rate of 15.68%, and a click rate of 2.01% (Source: Mailchimp.)
- Consumers spend an average of around 10 seconds reading marketing emails from brands. (Source: Statista.)
- Video continues to grow in importance as a marketing format, with around 78–80% of content marketers investing in video content. (Source: Content Marketing Institute.)
Ecommerce shipping statistics
- 88% of online shoppers prioritize ‘free’ shipping over ‘fast’ shipping, with 66% of shoppers willing to wait 3—7 days for their goods. (Source: Deloitte.)
- 69% of shoppers buying from an online retailer say that if their purchased item arrives more than two days after its expected delivery date, they are unlikely to shop with that retailer again. (Source: Ready Cloud.)
- Expensive shipping is among the top reasons for shopping cart abandonment. (See the Ecommerce abandoned cart statistics section below for more details.)
- Between 2014 and 2021, global parcel shipping volumes increased from 43 billion parcels to 159 billion parcels per year. China is leagues ahead of all other countries when it comes to parcel shipping volumes — 108 billion parcels were shipped in China in 2021 compared to 22 billion in the US and 9 billion in Japan. (Source: Statista.)
Ecommerce abandoned cart statistics
Cart abandonment refers to a situation where an ecommerce store visitor adds an item to their shopping cart, but exits the store without completing their purchase.
- According to the Baymard Institute, the average cart abandonment rate is 70.22%. (Source: Baymard Institute.)
- The biggest reason for cart abandonment, cited by 43% of online shoppers, is simply that they were browsing and not yet ready to buy. (Source: Baymard Institute.)
- 39% of shoppers say they abandoned their purchase because extra costs — such as shipping, taxes and fees — were too high. (Source: Baymard Institute.)
- 21% left a checkout because the estimated delivery time was too slow. (Source: Baymard Institute.)
- 19% of respondents abandoned a purchase because they didn’t trust the site with their credit card details. (Source: Baymard Institute.)
See below for the full top ten list of reasons for ecommerce cart abandonment.
| 1 | I was browsing / not ready to buy | 43% |
| 2 | Extra costs too high (shipping, etc.) | 39% |
| 3 | Delivery was too slow | 21% |
| 4 | I didn’t trust the site with my credit card | 19% |
| 5 | Had to create an account | 19% |
| 6 | Too long/complex checkout process | 18% |
| 7 | Returns policy wasn’t satisfactory | 15% |
| 8 | Website had errors / crashed | 15% |
| 9 | I couldn’t see total order cost upfront | 14% |
| 10 | Not enough payment methods | 10% |
| 11 | My credit card was declined | 8% |
Ecommerce dropshipping statistics
Dropshipping is a form of ecommerce where you don’t manufacture, store or ship any goods yourself. Instead you take orders for products via an online store, and pass them onto your supplier. The supplier then charges you, and sends the goods to the customer.
- The global dropshipping market is estimated to be worth approximately $464.44 billion in 2025, and is projected to grow rapidly to around $566 billion in 2026, driven by continued ecommerce expansion and increased adoption of low-inventory business models. (Source: Grand View Research.)
- Looking further ahead, the dropshipping market is forecast to reach approximately $1.25 trillion by 2030, representing a compound annual growth rate (CAGR) of around 22% between 2025 and 2030, highlighting its rapid expansion within the global ecommerce ecosystem. (Source: Grand View Research.)
- The average profit margin for a dropshipping business is 15%—20%. (Source: BlueCart)
- According to a 2025 survey of ecommerce professionals, approximately 32% of online retailers worldwide now use dropshipping as part of their business model, reflecting the ongoing popularity of low-inventory selling strategies. (Source: Oberlo.)
- There are currently around 775 dropshipping apps available for Shopify, 200 for WordPress, 33 for BigCommerce and 48 for Wix (Sources: Shopify, WordPress, BigCommerce and Wix).
Is print-on-demand profitable in 2026?
‘Print-on-demand’ (POD) is a form of dropshipping where products are sourced from a dedicated supplier of printed goods — items sold using POD typically include posters, apparel and wall art.
Instead of producing and storing large quantities of printed inventory in advance, POD allows for individual items to be produced as needed, typically using digital printing techniques. This approach reduces costs, minimizes waste, and allows full customization of products.
- Some print-on-demand industry observers report the average profit margin for print-on-demand business to be between 15% and 20%. (Source: Teeinblue.)
- The print-on-demand market was valued at approximately $4.1 billion in 2021 and is projected to be worth $39.87 billion by 2030, which represents a predicted compound annual growth rate (CAGR) of around 26.2%. (Source: Straits Research.)
- The home decor segment of the print-on-demand market is expected to see the highest growth rate in the POD sector, with an estimated CAGR of 27.7 over 2022 and 2023. (Source: Straits Research.)
- 20% of POD customers are willing to pay at least 20% extra for personalized POD products. (Source: Com Cap.)
- 45% of Americans have a ‘side hustle’ in addition to their main job. (Source: CPA Practice Advisor.)
- In 2022, the custom t-shirt printing global market size was valued at $4.31 billion. (Source: Grand View Research.)
- Printful is one of the most popular POD apps in the Shopify app store. It has an overall user rating of 4.8 stars out of 5 (based on 5,786 reviews).
Ecommerce payment provider statistics
- Online payment gateway providers are expected to have earned $138 billion in fees in 2024. (Source: Insider Intelligence.)
- PayPal total is the most popular ecommerce payment transaction provider — it has over 431 million users. (Source: Business of Apps.)
- As of February 2026, PayPal is valued at $38.96 billion. (Source: Companies Market Cap and Macrotrends.)
- The top 4 ecommerce payment providers in terms of market share are:
- PayPal — 44%
- Stripe — 22.56%
- Shopify Payments — 13.82%
- Amazon Pay — 2.06%
(Source: Datanyze.)
What is agentic commerce?
Agentic commerce is a new form of ecommerce in which AI systems like ChatGPT and Google’s AI-powered search tools can independently research products, compare options, and complete purchases on behalf of users — shifting ecommerce from human-driven browsing to AI-driven execution.
- AI assistants are rapidly becoming a new entry point for ecommerce. Tools like ChatGPT and Google’s AI-powered search experiences can analyze product options, summarize reviews, compare prices, and recommend purchases conversationally. Google’s AI shopping experience alone is built on its Shopping Graph, which contains over 35 billion product listings and refreshes more than 1.8 billion listings every hour, allowing AI systems to surface real-time product recommendations and purchasing options. This fundamentally changes ecommerce discovery — users no longer need to manually browse multiple websites. (Source: Google.)
- Agentic AI systems can take action on behalf of users — including navigating websites, filling out forms, and completing purchases. For example, OpenAI’s ChatGPT agent can browse the web, click buttons, fill in forms, and even order products online using the same interfaces humans use. This represents a major shift from AI acting as a passive recommendation engine to becoming an active participant in ecommerce transactions. (Source: OpenAI.)
- Major ecommerce platforms, marketplaces, and service providers are actively integrating AI agents into their infrastructure. Companies including Shopify, DoorDash, Instacart, OpenTable, Priceline, StubHub, and Uber are already working with AI agents to enable automated transactions and streamline purchases. Analysts expect this shift to accelerate rapidly. Gartner predicts that by 2028, 60% of customer interactions with brands will be handled by agentic AI, and industry forecasts suggest AI agents could influence a significant share of ecommerce transactions by the end of the decade. (Source: OpenAI.)
Ecommerce statistics for NFTs
‘Non-fungible tokens’ — NFTs for short — are a recent entrant to the world of ecommerce. Based on blockchain technology, an NFT is a unique, ‘uncopiable’ digital asset that can represent all sorts of collectible items such as art, music or games.
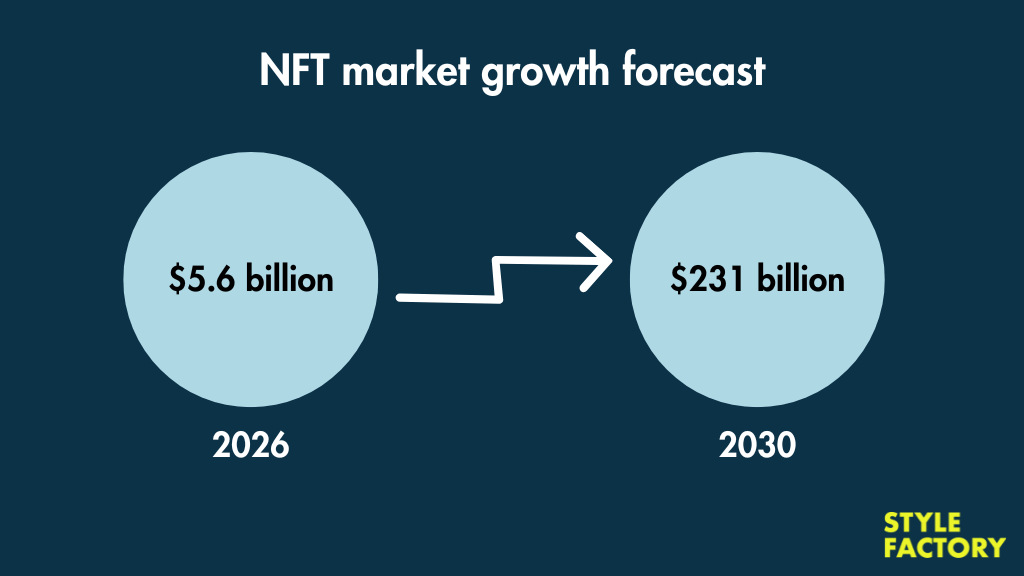
- The NFT market is currently valued at around $5.6 billion in total market capitalization as of 2026, reflecting a significant decline from its 2021–2022 peak but continued activity and consolidation. Long-term forecasts remain optimistic, with the global NFT market projected to grow to $64.7 billion in 2026 and potentially exceed $229 billion by 2031, as NFTs expand beyond collectibles into gaming, authentication, and digital ownership use cases. (Source: Coin Law.)
- 50% of all recorded NFT sales are for items worth less than $200. (Source: Nansen.)
- The first NFT is widely regarded to be the artwork ‘Quantum,’ minted by digital artist Kevin McCoy and coder Anil Dash in May 2014. Seven years later, Quantum sold for $1.47 million at Sotheby’s. (Source: Sotheby’s.)
- The most expensive NFT ever sold is considered to be ‘The Merge’ by Pak, which sold for $91.8 million in December 2021. (Source: Metaroids.)
- In February 2021, the digital artwork ‘Everydays — The First 5000 Days'”‘ by Beeple was the first purely digital artwork sold by a major auction house. (Source: The New York Times.)
- NFTs are particularly popular in Asia: more than 12% of affluent Asian consumers have bought an NFT and people in China, Hong Kong and Singapore tend to make the highest number of Google searches for NFTs. (Sources: Influence Marketing Hub and Statista.)
- 4% of Americans own an NFT. (Source: Nansen.)
- 80% of people in the UK and 70% of Americans do not know what an NFT is. (Source: Nansen.)
Ecommerce forecast statistics
- Some forecasters project that ecommerce will represent 24% of global retail sales worldwide by 2026. (Sources: IRP and Statista.)
- Ecommerce in metaverse environments remains small today, but long-term forecasts suggest substantial growth. Some analysts project the broader metaverse economy could reach over $936 billion by 2030, although adoption has been slower than originally expected. (Source: Grand View Research.)
- In the United States, 97% of people own a smartphone and 35% of people own a ‘smart speaker’. The overall revenue of ecommerce purchases transacted by ‘voice shopping’ through devices of all types is expected to rise by $164 billion in 2026. (Sources: Finances Online, PEW research Center and Consulterce.)
Other interesting ecommerce facts
- The first genuine ecommerce transaction took place in 1994 when Dan Kohn sold a Sting CD online to his friend Phil Brandenburger. The transaction — for a sum of $12.84 — was reported by the New York Times with the headline “Attention Shoppers: Internet is Open”. (Source: Michael Tefula and The New York Times.)
- The largest ever single ecommerce transaction is reported to be the purchase of a Gulfstream V business jet by businessman Mark Cuban for $40 million in 1999. (Source: Guinness World Records.)
- Cruise and ferry operators take the booby prize when it comes to ecommerce cart abandonment rates — a staggering 98% of online transactions in this industry are abandoned. (Source: Statista.)
- 110,000 Etsy sellers sold at least one face mask during the COVID-19 pandemic, resulting in over $346 million worth of mask sales on the marketplace. (Source: Digital Commerce 360.)
- Products sold via ecommerce can potentially be handled 20 times or more by the time they are delivered to the customer. (Source: Ameripen.)
- Ecommerce presents something of a spelling conundrum for writers — there are no less than 6 different forms of the word in use today: ‘e-commerce,’ ‘E-commerce,’ ‘ecommerce,’ ‘Ecommerce,’ ‘eCommerce’ and ‘e commerce’. (Source: The Future of Commerce.)
Other ecommerce resources and statistics from Style Factory
Ecommerce
- Ecommerce glossary — an A-Z of key ecommerce terminology
- Ecommerce platform reviews — our take on the most popular ecommerce platforms
- Ecommerce platforms — buyer’s guide — the key things you need to know before subscribing to an online store builder app
Statistics
- Canva statistics — key facts and figures about a leading design tool.
- ChatGPT statistics — data relating to the increasingly popular AI chatbot, ChatGPT.
- Shopify statistics — key facts and figures about one of the web’s most popular ecommerce platforms.
- Squarespace statistics — key facts and figures about a hugely popular drag-and-drop website builder.
- Wix statistics — key facts and figures about this leading store and site builder.
Update details
This article was updated on February 23, 2026. The following updates were made:
- Graphs and charts were updated.
- Global ecommerce forecast figures were updated.
- AI, agentic commerce, and AI-driven shopping statistics were added and updated.
- Voice commerce and metaverse ecommerce figures were reviewed and updated.
- Mobile, smartphone, and smart speaker usage statistics were updated.
- Global retail ecommerce share and adoption figures were updated.
No comments